
Vol. 1, Issue 4 (2013)
Chemometric Characterisation of Surface Water Quality in Uruan, Nigeria
Fig. 1: Location of Sampling Points in the Map of Uruan.
Fig. 2: Scree plot showing eigenvalues and principal components.

Fig. 3: Plot of rotated component loadings for five-factor model
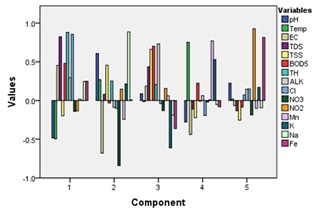
Fig. 4: Component plot in rotated space
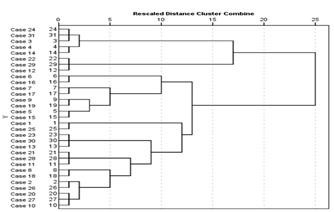
Fig. 5: Dendrogram using Ward’s linkage showing the clustering of sampling sites