Vol. 1, Issue 1 (2013)
Determination of Trace Amount of Cu(II) Using UV-Vis. Spectrophotometric Method.
Fig. 1: images/2.1.png
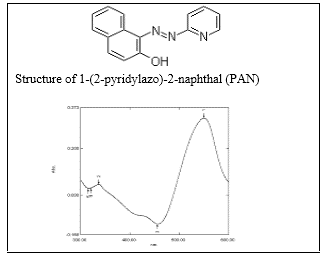
Fig. 2: Absorption spectrum of Cu (II)-PAN against the reagent blank (at pH=2.50, λMax=550 nm) in aqueous solution
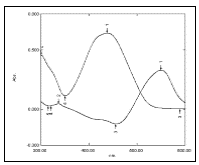
Fig. 3: Absorption spectrum of PAN and Cu (II)-PAN against the reagent blank at pH=2.50 in aqueous solution
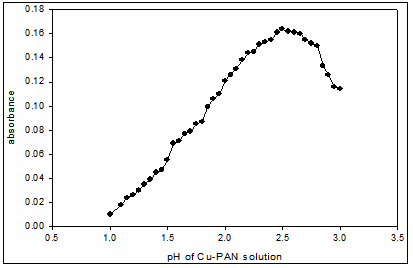
Fig. 4: Effect of pH on the absorbance of Cu(II)-PAN (1:10) complex
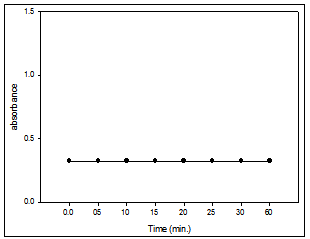
Fig. 5: Effect of the time on the absorbance of Cu(II)- PAN (1:10) system
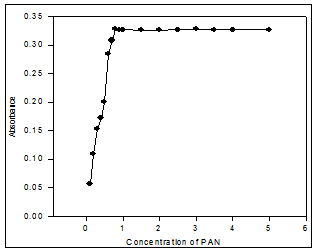
Fig. 6: Effect of reagent (PAN) molar concentration ratio on the absorbance of Cu(II)-PAN system.